AI Image Forgery Detection (Keras + Grad-CAM)
Scope note: learning project, not a production system. I iterate in small steps, write down assumptions, and call out trade-offs.
Last updated: 2026-05-31T06:48:12.867Z
Goal
Build a lightweight detector for synthetic imagery that can be audited easily. All artefacts (metrics JSON, TSV report, and Grad-CAM images) are read directly from public/projects/image-forgery so updating the page is as simple as dropping fresh files there and deploying.
Approach
- Train a compact Keras CNN on CIFAKE with light augmentation.
- Export metrics as
training_metrics.jsonand a TSV classification report. - Export two Grad-CAM overlays (
real-*,fake-*) alongside input samples to the public folder.
Guiding questions
- Can a compact CNN reach dependable accuracy on CIFAKE without heavy infrastructure?
- Which regions of an image trigger the forgery call, and are they visually plausible to a human?
- What evidence would an editor need before trusting or rejecting a classification?
Data
- CIFAKE: real vs synthetic images (Kaggle) supplies the training and validation splits.
- Page reads JSON and images from
public/projects/image-forgery. Updatingtraining_metrics.jsonchanges the chart; updating the images changes the overlays. - The full workflow, including reproducible notebooks, lives in the project repository.
Headline numbers
- Final training accuracy: 89.55%
- ROC AUC (hold-out): 9.7447 × 10⁻¹
- Grad-CAM overlays: 2
Model Card
/projects/image-forgery.Question
How quickly did the detector converge?
Epoch-level loss captured from the latest notebook run. Values are sourced from the exported training_metrics.json file.
Insight: Loss fell from 4.4629 × 10⁻¹ to 2.5567 × 10⁻¹ across 5 epochs.
Question
What accuracy did the model reach during fine-tuning?
Training accuracy (percentage) logged at the end of each epoch. Recorded alongside the loss metrics in training_metrics.json.
Insight: Accuracy peaked at 89.55% by epoch 5.
Question
ROC curve
True positive rate vs false positive rate at various thresholds.
Question
Precision-Recall curve
Precision vs recall across thresholds.
Question
Confusion matrix
Counts by predicted vs actual class.
Reproducibility
- Artefacts are read from
public/projects/image-forgery: metrics JSON, TSV report, Grad-CAM overlays, and the optionalmodel_card.json. - To update the page, replace those files and redeploy; no code changes are required.
- The notebook exports the same filenames on each run so the page stays stable across updates.
Classification report
| precision | recall | f1-score | support | |
|---|---|---|---|---|
| FAKE | 0.9290634316850005 | 0.9037 | 0.9162062148324631 | 10000.0 |
| REAL | 0.9062591258639151 | 0.931 | 0.9184629803186504 | 10000.0 |
| macro avg | 0.9176612787744578 | 0.91735 | 0.9173345975755567 | 20000.0 |
| weighted avg | 0.9176612787744578 | 0.91735 | 0.9173345975755568 | 20000.0 |
Explainability snapshots
These cards read directly from public/projects/image-forgery: the input images and their Grad-CAM overlays, plus confidences recorded at export time. To update them, replace the images and gradcam_results.json in that folder and redeploy.
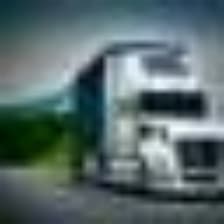
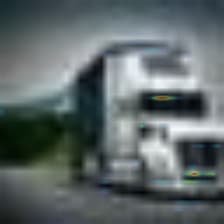

Prediction: FAKE at 99.69% confidence.

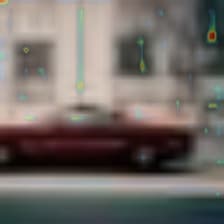
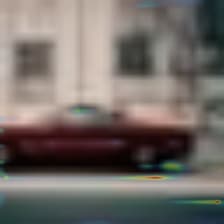
Prediction: REAL at 62.52% confidence.
Conclusion
- Training a compact CNN for 5 epochs reached 89.55% training accuracy while the loss fell from 4.4629 × 10⁻¹ to 2.5567 × 10⁻¹.
- 2 Grad-CAM overlays and the classification report ship with each run so reviewers can audit where the model focuses before trusting a prediction.